
The incredible amount of data in digital marketing makes it difficult even for marketing experts to present data clearly. With the Data Studio, Google has created a new free tool with which you can create your reports quickly and easily. The following article explains the advantages of Google Data Studio and the steps you need to take when setting up a Data Studio report.
There are numerous tools for creating reports in online marketing. Almost every platform offers the option of downloading data in the form of an Excel file. A major disadvantage here is that it is raw data that has to be further processed manually – which can take an enormous amount of time. Google Ads and Google Analytics each offer free dashboard solutions, albeit related to the individual platform. This means that the figures cannot be viewed and compared collectively. External reporting tools, on the other hand, are usually subject to a charge.
Why we love Google Data Studio
All data in one place and more combination options
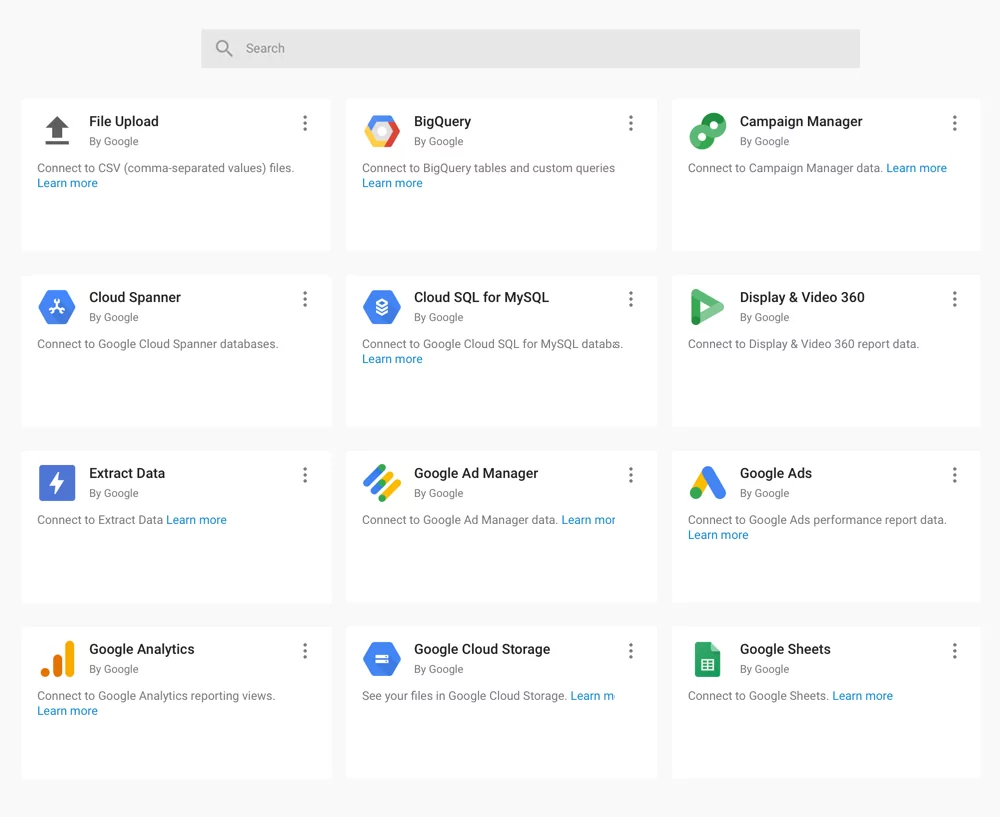
Dashboards can be created from a variety of data sources in the Data Studio. These include Google Ads, Google Analytics, Google Search Console and YouTube Analytics. Data from third-party providers can also be merged via many connectors in the Data Studio. These connectors include Amazon, Stripe, AdStage, Facebook, DoubleClick, Ebay, Twitter and many more.
Individualized dashboard
With Google Data Studio, you can summarize the available data sources in an individualized dashboard and make it visually appealing. Without any code or SQL queries. Some functions of the Data Studio are
- The ability to record multiple data sources in one dashboard
- Use your own corporate design for the dashboard and not that of the tool provider, as with Google Analytics, for example
- User-friendly design of the measured values with drag & drop function
- Easily add and edit text
- Display the data in different ways in the dashboard – time series, bar chart, table, map, etc.
- The dashboard can be easily shared via a link: send directly by email or save as a PDF
For better team work
Both individual employees and external parties can easily access, edit, comment on and manage different versions of dashboards. Both individual employees and external users can easily access different versions of dashboards. Users who do not have Google Analytics access can also be granted access, edit, comment on and manage them. No additional login is required and since mid-March 2019 there has also been a feature that allows you to share shortlinks with filtering directly.
Fast updating of data
The data can be updated with just a few clicks without having to create a new dashboard. Every time you log in to the dashboard, you can see the latest status.
Free tool
The Google Data Studio is a free tool from Google that allows us to do our job more efficiently and structure our data in a meaningful way.
Learn
more
We are more than just experts – our dedicated team of designers, developers and marketing specialists work hand in hand to take your digital presence to the next level.
Questions about Google Data Studio?
Contact us and find out more about our services.
How do I create my dashboard?
Set-Up
You can access the Data Studio tool at Google Data Studio. If you are already logged in with your Google account, simply click on “Start free” in the top right-hand corner and you will be automatically redirected to the homepage with various templates. You can create a completely new report or alternatively use one of the numerous templates.
Define the aim of the dashboard
- What should the dashboard display?
- What is the most important analysis question behind the dashboard?
- Who am I creating the dashboard for?
Set analysis period
Determine the analysis period based on the targets – do I have a campaign running and want to evaluate the KPIs for the period? Do I want to compare the performance of the website after the relaunch and before the relaunch or do I want a simpler monthly performance report of my website?
What data do I need for my dashboard?
- Which KPIs do I need to answer my analysis questions?
- Which events / targets are important for my analysis?
- Which segments do I already have and which do I still need to create?
- Which representations do I need? Trends, tables, comparisons with the previous month, etc.
Cluster data according to areas
Usefully cluster data within the dashboard according to various evaluations, e.g. page usage, user segmentation, etc.

Implementation
After going through all the steps of the data analysis, the implementation is not far away – let’s go!
We help you to prepare and interpret your data in a meaningful way
We create meaningful reports for our customers. With our help, you have an overview of valuable measured values that influence the ROI of your company. Please contact us for further information.
From the latest industry trends and the latest insights into AI and UX/UI design to exciting use cases.
Sign up for our monthly newsletter and stay up to date!
Stay
tuned
More articles